Table of Contents
- What is an Infographic?
- How Much Does a High-Quality Infographic Cost?
- Factors That Determine Quality Infographic Design Cost
- How To Reduce Infographic Costs
If you are active on any social media platform, you’ll definitely notice how brands share content. No longer do they use just words or directly position their product in the hope of making a sale.
Today, brands use several tactics to impress and engage users, enable them to feel trusted, and then make a potential sale. Or in some cases, their entire social media or digital marketing strategy will revolve around creating value and creating a brand presence.

One of the most potent ways to do so is by using infographics. Infographics are sharp and simple visual designs that represent a story, highlights, or aspects of a topic. They must be highly engaging and visually appealing. Users love infographics because they are easy to understand and provide impactful content, maximizing the chances of your brand or content getting noticed.
According to research, infographics are still the best way to share content.
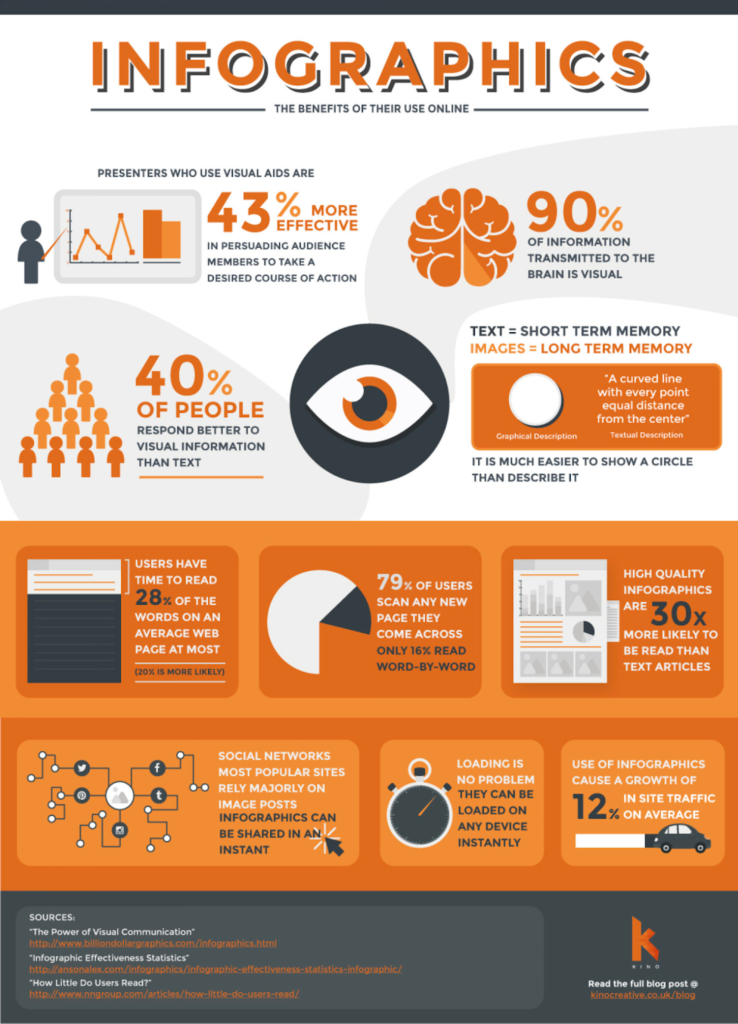
- Visuals like charts, graphics, color, design, and images increase readership by 80%.
- Visuals increase learning and information retention by 78%.
- People remember 65% of the information they see in a visual.
- Infographics improve reading comprehension by 50%
- 50% of the human brain is used for processing visual information.
Want to create infographics of your own? While companies or content creators want to create infographics and visual designs, most do not have the in-house resources or budget to hire full-time designers.
Working with freelancers or a digital agency to create quality infographics can be costly unless you follow a set process. Keep reading as we explain all there is to know about creating infographics and how working with the right design agency can help you develop excellent infographics for your visual marketing.
What is an Infographic?
In a nutshell, infographics are high-level information you wish to communicate to your target audience presented in a digital or visual form. This information converted into a visual format makes it easier for your target audience to consume and understand the data.
People retain visual knowledge better than audio or written content. Thus, infographic designs are collections of images, graphs, and charts with minimal written content or text that make it easier for people to understand the content displayed.
How Much Does a High-Quality Infographic Cost?
Although this is one of the most frequently asked questions for any design agency, the answer is not so simple. For example, the cost of an infographic can range from a few thousand to be made entirely free. Why?
It all depends on what it takes to create an infographic. For example, if the infographic to be designed is straightforward and the customer already provides most of the content and design expectation, the design agency can charge a minimum amount for creating this infographic. However, the cost will increase accordingly if you need the agency to craft content, create the outline, and showcase the final design.
Most freelance designers and agencies will charge you as little as $20 or $50, while excellent design agencies charge $1000 or more to create stellar infographics. Some infographics can even be designed on free online tools.

For a simpler infographic design, you can use pre-made templates available on the Internet or work with a design agency to create a simple template that can be reused. However, the best infographics use specific elements and designs crafted especially with the particular design or content in mind, making it highly personalized and impactful.
This helps it stand out from the competition, which will only use online designs or resources. In a world with enormous competition, creating an infographic from a professional with expert content is always ideal.
Factors That Determine Infographic Design Cost
The cost of creating an infographic varies as per the amount of effort required and the elements that need to be used. To understand how the price of an infographic is determined, we need to understand the 5-step process that goes into creating an infographic. The typical infographic creation process looks as follows:
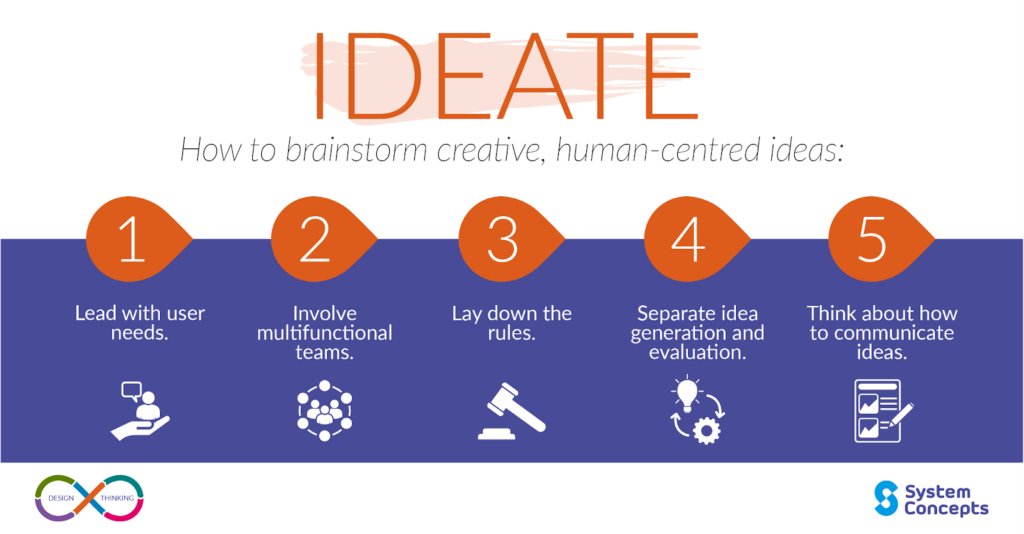
1. Ideation
The first step in creating an infographic is to finalize a topic or idea. Since every infographic focuses on a particular theme, story, or specific goal, it is good to brainstorm with the team to understand their expectations.

This includes teams like design, content, marketing, and business-focused departments, which can add their inputs on what the infographic should have.
If working with an agency, the in-house team should ideally handle the ideation step, as they know the market, audience, products or services, and the business better. This also ensures that the freelancer or design/content agency can get clear guidelines and understand what is expected, making the process a lot simpler and more effective.
2. Research and gathering information
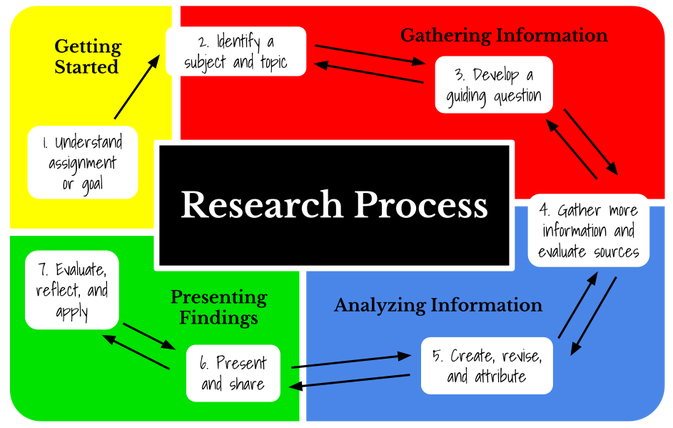
The research process begins once a topic is selected. Since infographics rely heavily on presenting facts, data points, and statistics, the research needs to be interesting and accurate. Even if there is a minor flaw, it can hugely impact your overall brand image.

For research, it is ideal to have someone not just focus on gathering information but also check each source and ensure that the information to be used for the infographic is reliable, up-to-date, and accurate. If even one point is false or comes from an unreliable source, it should not be used in the infographic.
3. Content finalization
With the basic idea and research in place, it is time to finalize the content that will be shared with the design team. The content for an infographic is different from that of a written piece, as it needs to be short, powerful, and persuasive.
Infographics should focus on presenting facts and a set narrative to ensure the readers are hooked and want to know more. It is ideal to have an expert content writer handle this part as it requires strong copywriting skills and an understanding of the subject to write impactful and factual content.
4. Design structure
Once you finalize the content and the basic idea for an infographic, it is time to move on to the design process. The first aspect of designing an infographic is understanding how the content is structured. For this, designers can create layout options, wireframes, or outlines that can help define how the end design will be.
Getting the layout or structure approved before intensive designing helps save on revisions and allows designers to understand the content or marketing team’s vision. This helps all parties involved be on the same page and increases the chances of creating an impressive outcome.
5. Design finalization
Whether you have a full-time designer or an external agency, creating an infographic cannot be a one-shot process. It requires several iterations of hard work to get the right outcome. Design finalization is where all teams, be it the team managing digital marketing, branding, graphic design, and content, are on the same page and approve the infographic.
Since revisions can often take up additional time and effort, it is ideal to have a contractual agreement that mentions the number of revisions and outlines exact expectations. Any modifications or changes which need a complete refresh will incur additional costs.
So, instead of waiting for the outcome, check the infographics in phases to minimize the need for revisions.
How to Reduce Infographic Costs
Creating an infographic can have multiple steps and may not always be as simple as outlined above. Some factors that add to the cost of creating an infographic design include the following:
- Level of in-depth research required
Although the client can provide content for the infographic, it is often not the case due to stringent deadlines and a lack of resources. While content writing and research can be outsourced, it will bear a cost depending on the required level of in-depth research. In addition, because content has to be fact-checked and relevant to the overall storyline, it can take up time.
To simplify this process, share a clear idea of your expectations and provide valuable references so that the research part doesn’t take too much time. Check-in on the research from time to time, as it will save additional time and effort if the research is not in line with the expectation.
- Creation of custom branded assets
Branding is expensive, mainly because the design elements and fonts will be unique to your brand. If your brand’s logo, color scheme, and font need to be created from scratch and added to the infographic design, it will add to the overall cost.
The ideal way to save this cost is to share the brand guidelines with the designers and provide all the required icons and imagery that you already have. Then the designer or design agency only has to create new icons and illustrations where required and can easily replicate your brand design uniformly.
- Licensing for fonts and images repository
Depending on the requirement and the expected outcome, there is often a need to use unique typography or fonts, images, or widgets, which need to be licensed. While some design agencies will include this cost in the agreement, it is ideal for you or the organization to purchase the licensing and ensure that the resource and related expenses are handled in-house.
- Distribution and promotion
Are you also looking at an agency to help promote your infographic on social media and other digital channels? The distribution cost depends on the agency you are working with and often adds to the overall cost. You can save on this cost if you are doing this in-house.
Key Takeaways
- Infographics are the high-level information you wish to communicate to your target audience presented in a digital or visual form. This information converted into a visual format makes it easier for your target audience to consume and understand.
- Users love infographics because they are easy to understand and provide impactful content, maximizing the chances of your brand or content getting noticed.
- Infographics improve reading comprehension by 50%.
- The cost of an infographic can range from a few thousand to being entirely free, as it depends on the requirement and resources needed to get the job done.
- To reduce the cost of creating infographics, it is ideal to:
- Simplify research
- Provide custom branded assets, which include icons, illustrations, and logos, ensuring the designer doesn’t have to create elements from scratch.
- Ensure licensing for fonts and images is provided or included in the final agreement.
- Ensure rework is minimal, and add-on costs are mentioned in the agreement.

The Final Word
Making a high-quality infographic is crucial, especially in today’s digital era, where media users’ attention span is significantly low. Infographics help create an impact and are a great hook to attract attention from your target audience. But is it worth spending thousands of dollars on it?
It certainly is! With Pepper, you can work with professional designers and curated content writers to help research, write and design your infographic. Our team is highly professional, rated, and skilled, ensuring that you work with the best minds to do the job of creating an infographic a lot more efficiently. If you have thought of creating an infographic for your brand and need professional expertise to bring it into action, click here for more details!
FAQs
Infographics can be defined as a visual representation of any kind of information or data. It uses visuals and texts to communicate essential information and ideas to the target audience.
1. Do your research and be diligent when choosing the data you want to communicate with your audience. Keep it as short and crisp as possible.
2. Always select the best template layout ideal for your content type and length.
3. Create a copy outline and data visualizations to make the best infographics.
4. Make sure you use high-quality graphics and simple imagery. Also, use a custom infographic color scheme to set the right tone.
5. Break down your data into groups or sections, making it easier for users to consume and share information.
A good infographic should be clear and simple to understand. The infographics should be meaningful, crisp, and clean, which should clearly communicate your point.
There are many infographic tools that help to create a good infographic right from scratch. Snappa, Visualise.me, Venngage, Canva, Cisme, etc., are some such tools.
Latest Blogs
Learn how to rank on AI search engines like ChatGPT, Perplexity, and Gemini by optimizing your content for authority, structure, and relevance. Stay ahead in AI-driven search with this strategic guide.
Explore the best healthcare SEO services for your medical practice. Improve online visibility and effectively reach more patients in need of your services.
Discover top social media agencies specializing in banking solutions, enhancing financial services and driving engagement.
Get your hands on the latest news!
Similar Posts

Design
7 mins read
15 Best Firms Offering Design Services in India

Design
5 mins read
All You Need to Know About Data-Driven Design

Design
6 mins read