Unleashing the Power of Interactive Infographics: How Brands Craft Viral Content

Imagine this: you’re scrolling through your social media feed when a visually stunning interactive infographic catches your eye. It’s colorful, it’s engaging, and it promises to provide you with valuable information. You can’t help but click on it and share it with your friends, because who wouldn’t want to be the first one to share something so fascinating? This is the magic of infographics done right.
In the past, simply creating an infographic was enough to attract attention and generate shares. But with the increasing competition for attention online, brands need to step up their game. They must create visually captivating and informative and interactive infographics that resonate with their target audience. And that’s exactly what we’re going to explore in this article – how brands can craft compelling infographics meant to boost a brand’s content marketing and have the potential to go viral.
So grab your notepad and get ready to take some notes, because we’re about to dive deep into the art of crafting irresistible infographic content.
What are Interactive Infographics?
Interactive infographics are digital representations of information or data that allow users to engage with the content interactively. Unlike static infographics, which present information in a fixed format, interactive infographics offer a dynamic experience where users can explore different aspects of the data, manipulate variables, and interact with visual elements.
These infographics often include features such as clickable elements, animations, sliders, maps, charts, and other interactive elements. Users can click on specific parts of the infographic to reveal more detailed information, zoom in or out, change filters, or navigate through different sections. This interactivity enhances user engagement and understanding by providing a more immersive and personalized experience.
Interactive infographics are commonly used in various fields, including journalism, education, marketing, and data visualization, to present complex information in a visually appealing and user-friendly way.
The Art of Crafting Compelling Infographic Content
When crafting an infographic, the first step is to choose a topic that resonates with your target audience. It should be something they find interesting and relevant to their lives. To do this, you can start by monitoring trending topics and social media conversations. By staying in tune with what’s popular, you can tap into the collective curiosity of your audience.
One brand that excels at choosing trending topics for their infographics is Airbnb. Their ‘Travel Trends’ infographic is a prime example of how to create compelling content. By analyzing user data, they were able to highlight popular destinations and travel habits. The content marketing infographic showcased a world map with highlighted locations and included statistics on the most visited cities and average stay durations. This not only engaged their audience but also provided valuable insights for travelers. For example:

Making Infographics Interactive
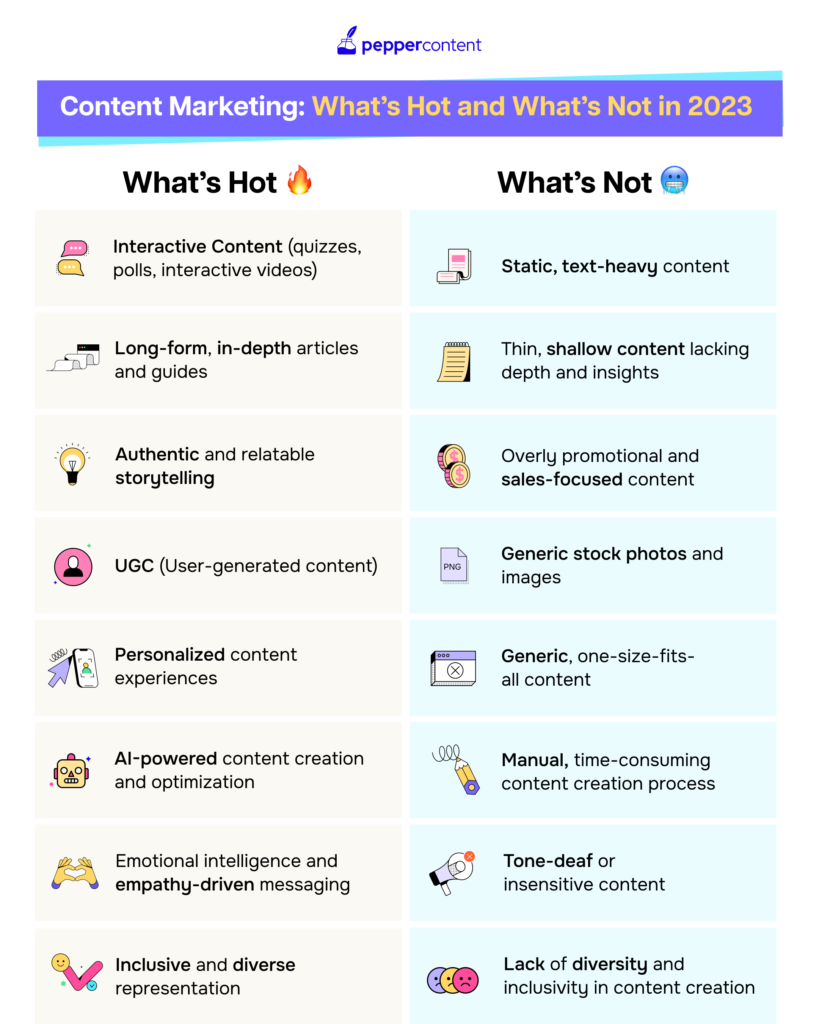
Interactive elements in infographics take engagement to a whole new level. They allow users to actively participate and explore the information presented, making the experience more personalized and immersive.
This type of dynamic interactive infographic not only captures attention but also encourages users to spend more time interacting with the content. The more engaged users are, the more likely they are to share it with others, leading to increased brand exposure and reach.
By embracing interactivity in content marketing infographics, brands can create a memorable user experience that goes beyond passive consumption. Making interactive infographics is a game-changer in content marketing. Brands that embrace this approach will not only captivate their audiences but also foster a deeper connection and engagement with their brand. So, why settle for static infographics when you can create an immersive experience that leaves a lasting impression?
Leveraging Social Media Platforms
In today’s digital landscape, social media platforms have become the go-to channels for brands to showcase their content. When it comes to infographics, optimizing them for different social media platforms can significantly increase their reach and engagement levels.
First and foremost, utilizing relevant hashtags is a tried and true tactic for boosting infographic visibility. By using popular industry-specific hashtags, brands can ensure their infographics are discovered by users who are actively searching for related content.
Storytelling through Sequential Infographics
Storytelling has always been a powerful tool to captivate and engage audiences. With the rise of interactive infographics, brands have found a unique way to tell stories through sequential visuals. Sequential infographics are a series of interconnected graphics that unfold a narrative piece by piece. This format allows brands to create anticipation, suspense, and interest, making it an effective technique for capturing attention and driving engagement.

What makes sequential infographics effective is their ability to create suspense and curiosity. By revealing information gradually, brands can keep audiences engaged and eager to learn more. It’s like reading a book or watching a TV series – each piece builds on the previous one, creating a sense of anticipation and ensuring that readers stay hooked until the end.
To create impactful sequential infographics:
- Plan your narrative: Outline the main points you want to convey and decide how to structure them across multiple graphics.
- Visual consistency: Maintain a consistent visual style throughout the series so that each infographic feels connected and part of a larger story.
Harnessing Data Visualization
When it comes to crafting compelling infographics, one of the most powerful tools at a brand’s disposal is data visualization. In our data-driven world, presenting information engagingly and understandably is crucial. Infographics provide the perfect platform for brands to transform complex data into visually appealing and informative content that captivates their audience.
Brands can leverage infographics to present data in a variety of formats, such as charts, graphs, and maps, that make it easier for viewers to comprehend and absorb the content of infographics. By breaking down large sets of information into digestible visual components, brands can create a more engaging experience for their audience.
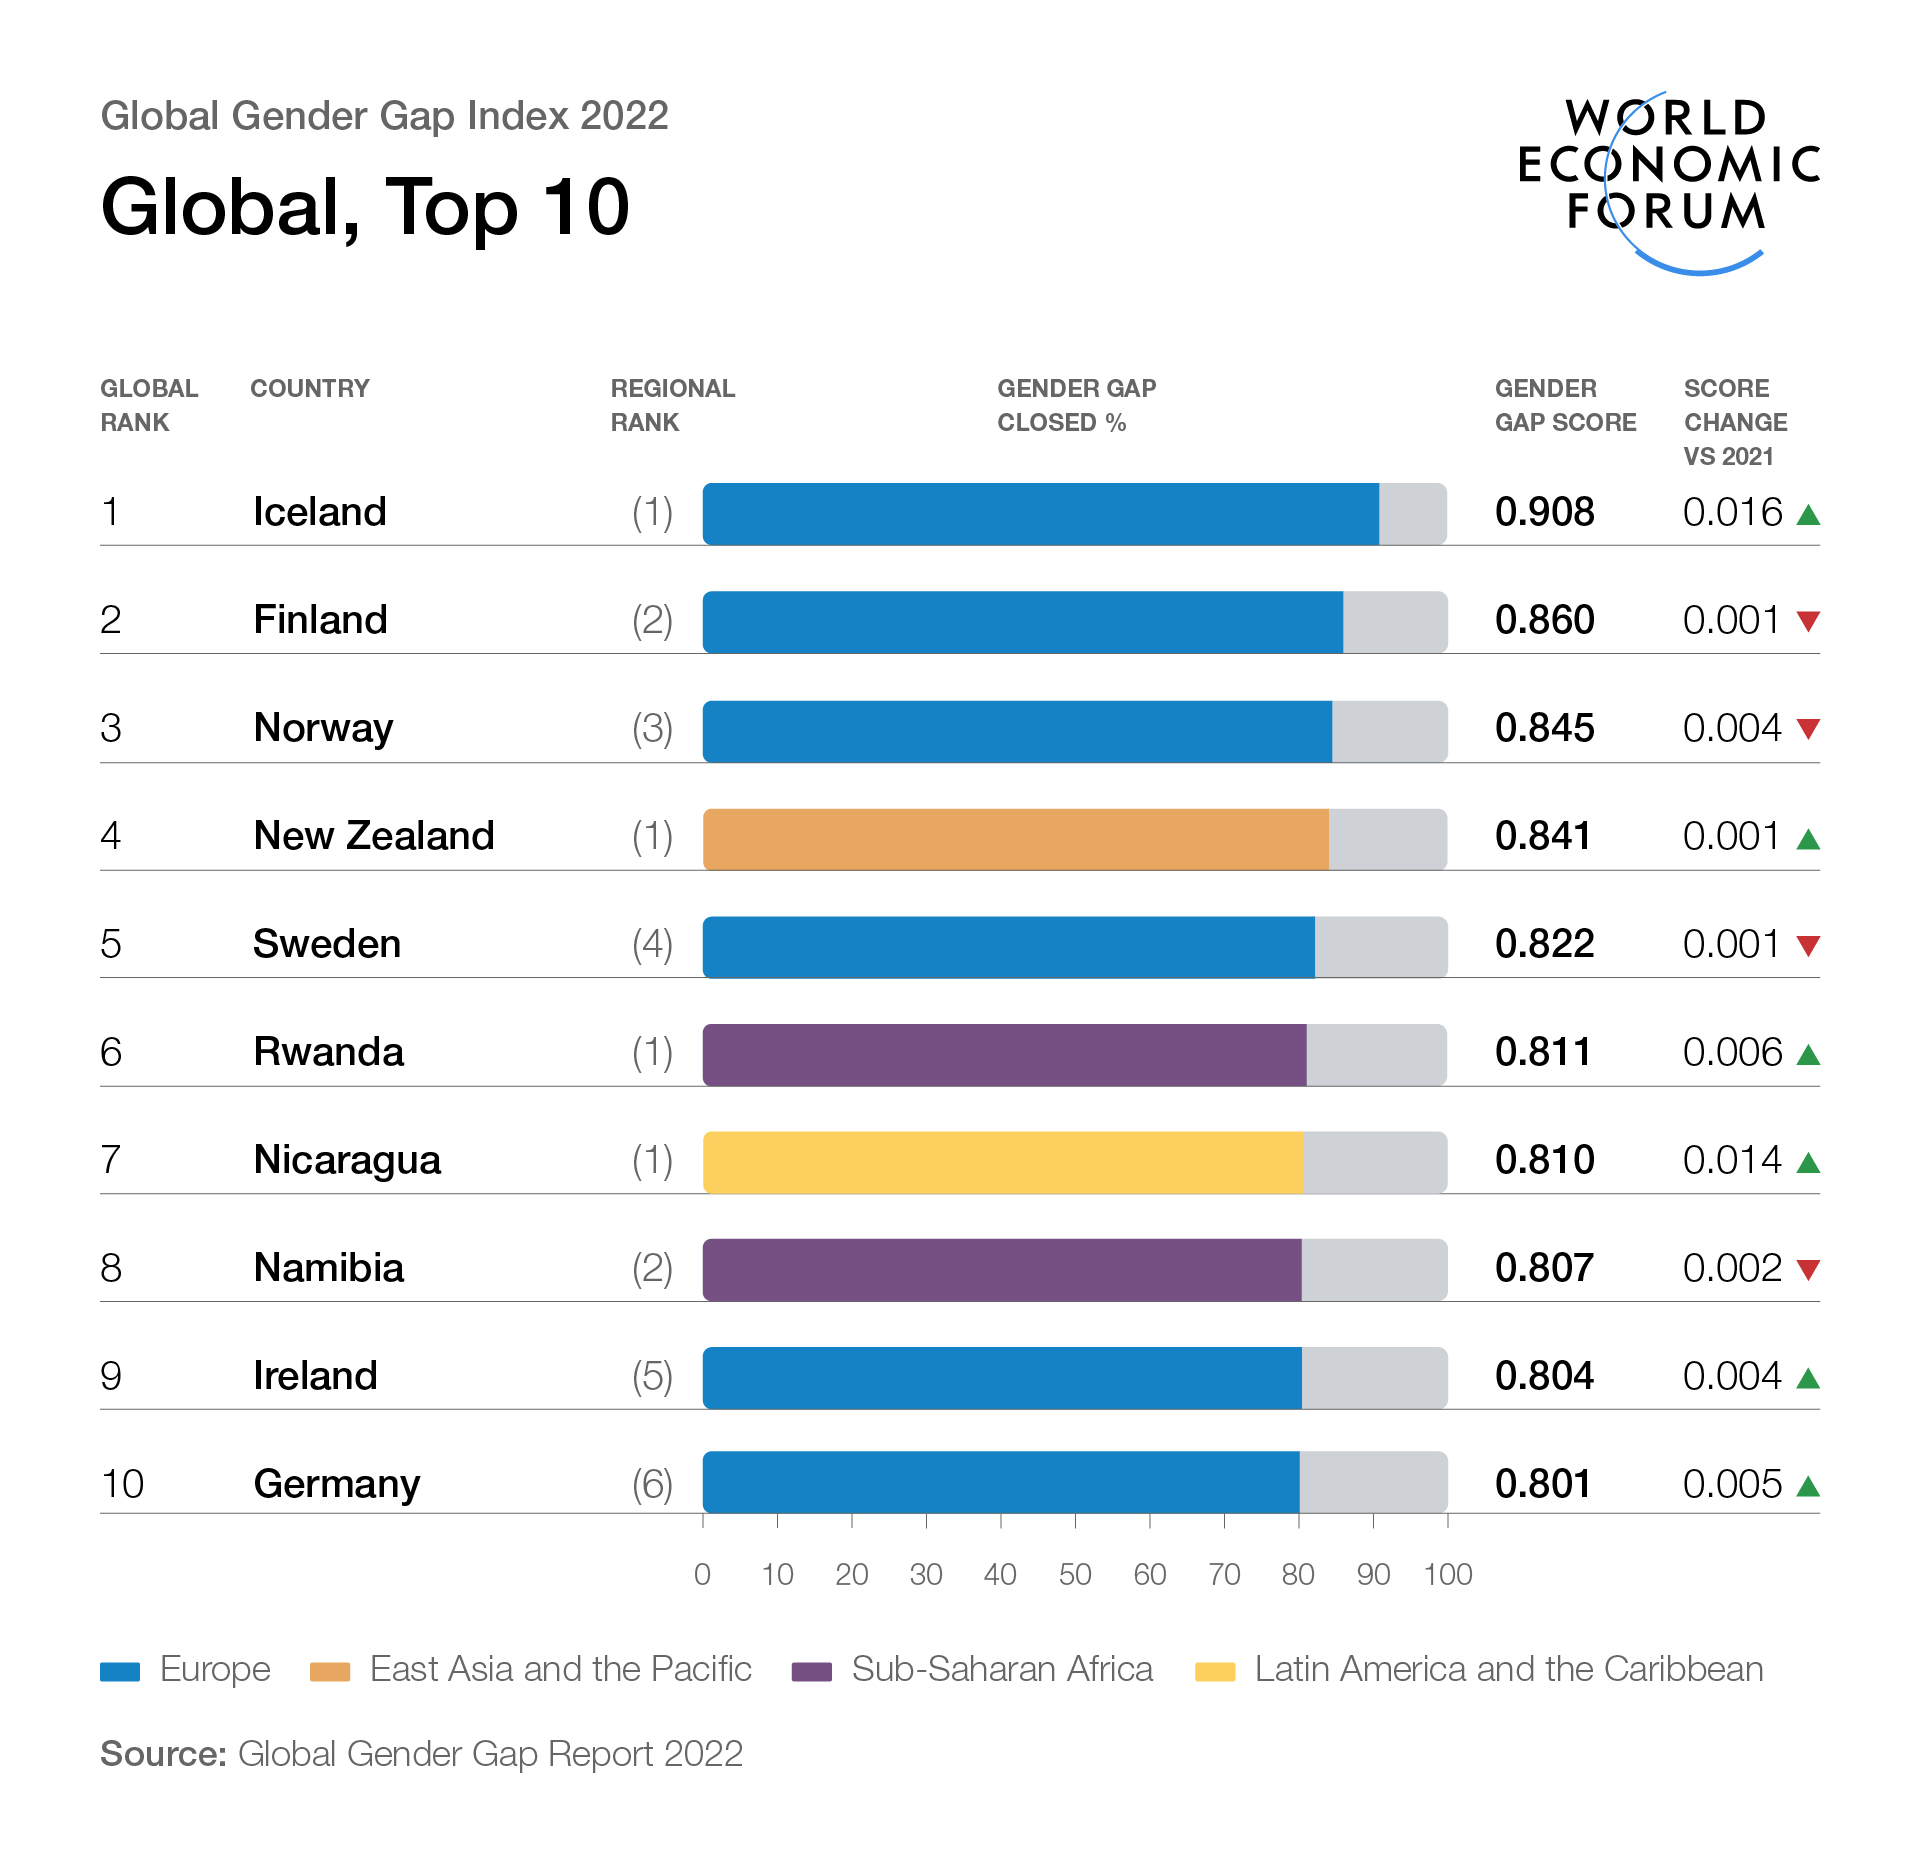
Let’s take a look at an example that showcases the power of data visualization in infographics. The World Economic Forum’s ‘Gender Gap Index’ infographic is a prime illustration of how statistics can be presented visually to convey important messages effectively. The infographic displays gender equality rankings across countries using a range of vibrant colors and graphics. With just a glance, viewers can assess the progress made in various regions and identify areas that require attention.

The key to harnessing data visualization lies in finding the right balance between aesthetics and clarity. While it’s essential to create visually appealing designs, it’s equally important not to sacrifice the accuracy and comprehensibility of the information being presented.
Promoting Infographic Sharing and Link Building
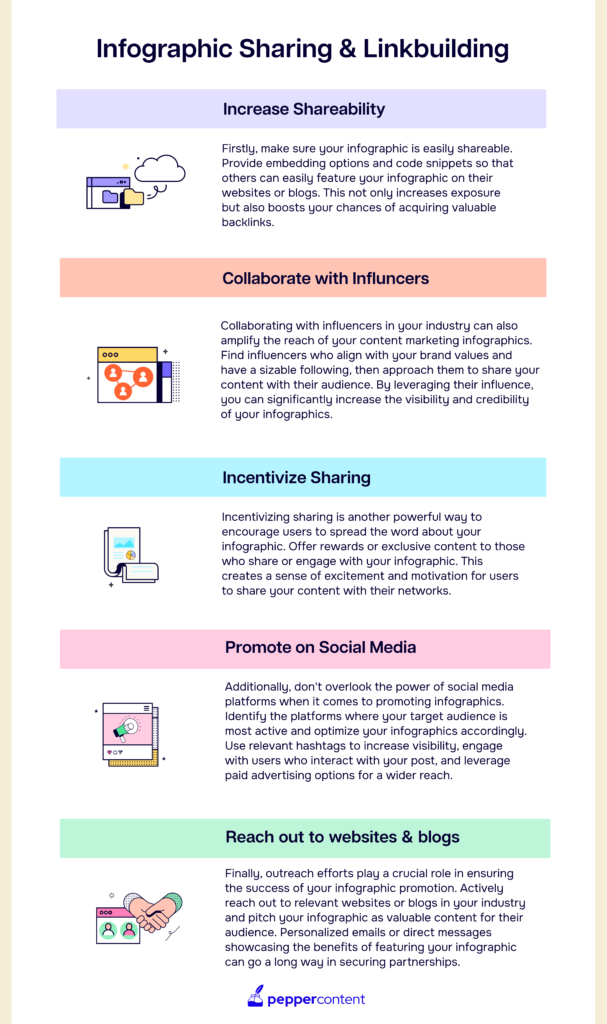
Now that you’ve created a visually stunning and informative interactive infographic, it’s time to ensure it reaches as many eyes as possible. Promoting infographic sharing and link building is crucial to maximizing its reach and impact.

Infographics are a powerful tool that can create viral content and engage audiences when used effectively. By experimenting with new techniques while staying true to their brand identity, content marketers can unleash the power of interactive infographics and take their content marketing strategies to new heights. So go ahead, get creative, and start designing captivating infographics that will captivate your audience and skyrocket your online presence! Need some help? Get in touch with our design team which specializes in designing infographics that draw more views and leads.
Latest Blogs
Learn how to rank on AI search engines like ChatGPT, Perplexity, and Gemini by optimizing your content for authority, structure, and relevance. Stay ahead in AI-driven search with this strategic guide.
Explore the best healthcare SEO services for your medical practice. Improve online visibility and effectively reach more patients in need of your services.
Discover top social media agencies specializing in banking solutions, enhancing financial services and driving engagement.
Get your hands on the latest news!
Similar Posts

Content Strategy
5 mins read
Choosing The Best Healthcare Marketing Agency For Effective Content Solutions

Content Marketing
4 mins read
Top 10 Agencies B2B SaaS Content Marketing for B2B Success

B2C Marketing
5 mins read